


36th European Photovoltaic Solar Energy Conference and Exhibition
Analysis of Fielded PV-Modules with Backsheet Issues
Peter Lechner, Heiko Wirth, Jonathan Schnepf, Simon Hummel, Dieter Geyer (1)
Bernhard Weinreich, Rudolf Haas (2)
(1) Zentrum für Sonnenenergie- und Wasserstoff-Forschung Baden-Württemberg (ZSW)
Meitnerstr. 1, 70563 Stuttgart, Germany
(2) HaWe Engineering GmbH Mühlthaler Weg 1, 82131 Gauting-Hausen, Germany
Corresponding author: peter.lechner@zsw-bw.de, Tel.: +49 711 7870 254
ABSTRACT: A sharply increasing number of modules with backsheet (BS) issues has been noticed during the recent years.
BS issues like chalking, browning, cracking and delamination were observed. With FTIR spectroscopy, the backsheets
addressed in this study were identified as AAA polyamide based BS. The modules under investigation have been in operation
for 6 to 8 years. Sample modules with BS issues were taken to ZSW´s test lab for detailed analysis. AAA polyamide backsheet
specimen, corresponding to machine direction (MD) and the transversal direction (TD) of polymer extrusion, were dissected
from the modules and submitted to elongation at break tests. In addition, BS peel tests were executed. Aim of this work was to
correlate the occurrence of backsheet cracks with elongation at break measurements; and the occurrence of delamination with
peel force measurements. Cracks occur when the remaining elongation to break is below 30 %. Delamination and corrosion
come along with low peeling forces at the interface of BS and EVA.
Keywords: Fielded PV modules, polymeric backsheet, failure modes
1. INTRODUCTION
Conspicuous conditions and damages of PV modules
backsheets (BS) have increasingly been observed during
inspections of PV installation sites. Features and issues
range from chalking, loss of gloss, yellowing and
discoloring (existing on both front and back side) to
cracking and delamination of the BS from the substrate.
Chalking may be an uncritical loss of colour from the
surface. During certification assessment according to IEC
61730:2016, chalking of the BS is currently not considered
a fail criterion [1]. Cracks or delaminations constitute an
advanced state of degradation. Possible consecutive faults
are isolation faults, generator shutdown and loss of
electrical safety leading to risks for personal health.
In this contribution we show, how conspicuous conditions
and damages of the BS correlate to laboratory
measurements of elongation-at-break and adhesion of the
BS. The described evaluation methods allow to judge on
the remaining quality level of both PV modules apparently
affected by modifications of the BS as well as PV modules,
which are in yet inconspicuous condition. It is also
possible to base an estimate on the prospects of repair
methods on these evaluations.
2. EMPIRICAL FINDINGS AND DISCUSSION
2.1 Abnormal features on BS and subsequent damages
During site inspections, abnormal features of backsheets have been observed on PV modules of notable producers, namely chalking, discoloration, and delamination, as well as subsequent damages such as corrosion, hot-spots and isolation faults. The investigated modules had been deployed on sites in temperate climate as well as in a dry/hot climate zone in field exposure and in one case in a rooftop installation. Sample modules for detailed laboratory investigations have been chosen in the field covering both affected and inconspicuous specimen. Field service time of the modules up to the sampling had been 6 to 8 years depending on the PV plant. The material type of the BS has been identified employing FTIR analysis as described below. The results presented here are restricted to PV modules with backsheets from polyamide (PA).
During site inspections, abnormal features of backsheets have been observed on PV modules of notable producers, namely chalking, discoloration, and delamination, as well as subsequent damages such as corrosion, hot-spots and isolation faults. The investigated modules had been deployed on sites in temperate climate as well as in a dry/hot climate zone in field exposure and in one case in a rooftop installation. Sample modules for detailed laboratory investigations have been chosen in the field covering both affected and inconspicuous specimen. Field service time of the modules up to the sampling had been 6 to 8 years depending on the PV plant. The material type of the BS has been identified employing FTIR analysis as described below. The results presented here are restricted to PV modules with backsheets from polyamide (PA).
2.1.1. Chalking
Chalking can be determined by wiping off the surface, at easiest just with the fingers (Figure 1). Attended with the chalking, mould formation is repeatedly observed, especially at sites in temperate climate. High-resolution Scanning Electron Microscope (SEM) imaging reveals nanoparticles with a typical size of about 150 nm at the surface (Figure 2). With Raman spectroscopy, the excavated pigments were identified as titanium dioxide (TiO2) in a rutile crystal structure (Figure 3). This is a highly effective UV absorber and is added to the BS in order to protect the polymer from UV radiation. Concurrently, TiO2 nanoparticles show a photocatalytic activity in UV radiation, which is undesirable in this application. By this, free radicals causing photo-oxidation can result, which damage the polymer at the interface to the TiO2 nanoparticles and may dissolve these from the compound with the polymer [2]. TiO2 comes in two variates, anatase and rutile, whereby rutile has a lower degree of photocatalytic activity and is therefore preferred for the application as a stable white pigment. For even higher demands of stability and non-chalking, TiO2 nanoparticles are coated with passivating materials such as silica or alumina [3]. These requirements apparently have not gained sufficient attention in the production of the polyamide BS.
Chalking can be determined by wiping off the surface, at easiest just with the fingers (Figure 1). Attended with the chalking, mould formation is repeatedly observed, especially at sites in temperate climate. High-resolution Scanning Electron Microscope (SEM) imaging reveals nanoparticles with a typical size of about 150 nm at the surface (Figure 2). With Raman spectroscopy, the excavated pigments were identified as titanium dioxide (TiO2) in a rutile crystal structure (Figure 3). This is a highly effective UV absorber and is added to the BS in order to protect the polymer from UV radiation. Concurrently, TiO2 nanoparticles show a photocatalytic activity in UV radiation, which is undesirable in this application. By this, free radicals causing photo-oxidation can result, which damage the polymer at the interface to the TiO2 nanoparticles and may dissolve these from the compound with the polymer [2]. TiO2 comes in two variates, anatase and rutile, whereby rutile has a lower degree of photocatalytic activity and is therefore preferred for the application as a stable white pigment. For even higher demands of stability and non-chalking, TiO2 nanoparticles are coated with passivating materials such as silica or alumina [3]. These requirements apparently have not gained sufficient attention in the production of the polyamide BS.
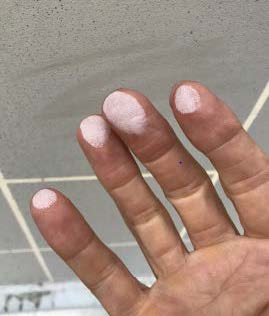
Figure 1: Chalking (left); mould formation (right)
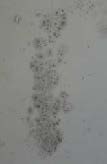
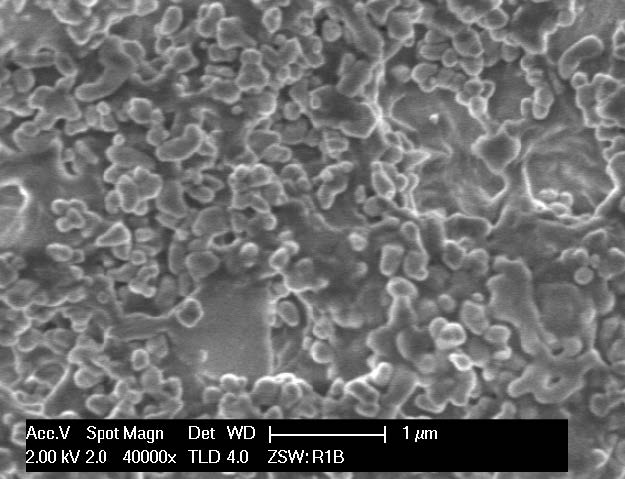
Figure 2: SEM image of the surface of a chalking
polyamide backsheet sample with released TiO2 pigments
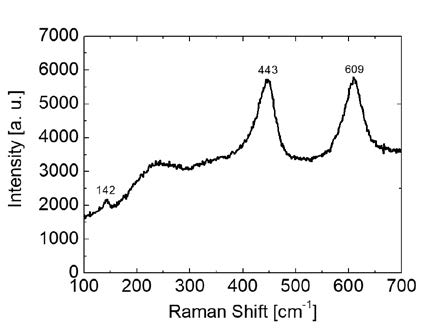
Figure 3: Raman spectrum of TiO2 rutile pigments
2.1.2 Formation of cracks
The formation of cracks showing up in a progressed state can be observed easily with the naked eye in the back view of the module, but first small cracks can be overlooked easily.
Within the study presented here, cracks did occur in the cell gap and over the cell tabbing wires ().Additionally, it is observed that the cracks mostly develop along the PV module, i.e. parallel to the long side of the module.
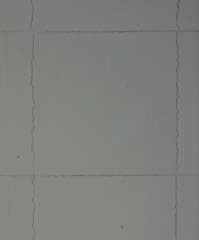
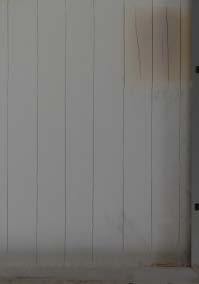
Figure 4: Cracks in the cell gap (left) and over the cell
connectors (right).
Further, there is a particular dynamic of the formation
of cracks. In a typical case, a first formation of a crack
could be observed during the annual plant inspection in the
sixth year of service, whereby the modules had beeninconspicuous the year before. In the seventh year of
service, the cracks had significantly increased and the
damage was clearly visible (Figure 5).
In the SEM image (Figure 6), very tiny cracks of a
width of a few micrometres show close to a big crack of
about 200 μm. In a more detailed SEM image of the big
crack, glass fibres can be observed which have been added
to the polyamide foil for enforcement. In Figure 7, it can
be seen that the small cracks affect the top layer of the BS
only.
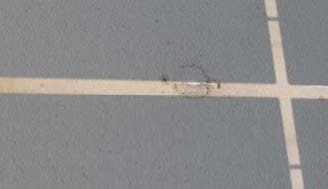
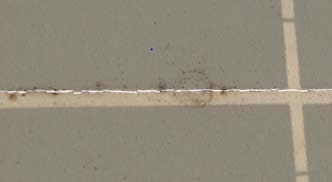
Figure 5: Year to year development of a BS crack,
observed within the annual inspection;
crack initiation after 6 years operation (top), fully propagated in the 7th year (bottom)
crack initiation after 6 years operation (top), fully propagated in the 7th year (bottom)
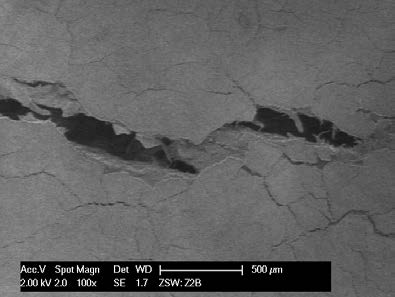
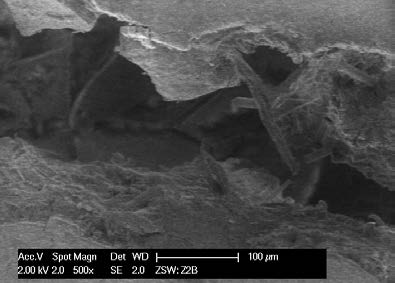
Figure 6: SEM images of a wide crack, in differently
detailed resolution
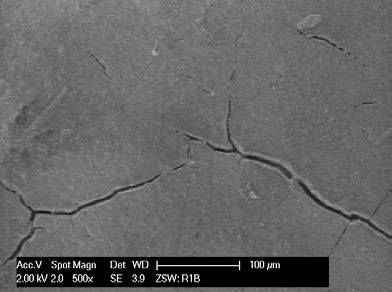
Figure 7: SEM image of small superficial cracks
2.1.3 Delamination, corrosion and open cell strings
Delamination of a polyamide backsheet at the top edge of a PV module can be seen in Figure 8 (left). The corrosion of a solder joint between a cell connector and a cross connector at the lower module edge has already led to visible formation of green copper acetate (Figure 8, right) which results from a chemical reaction of copper from the connector and acetic acid from the EVA. Possible outcome of this corrosion is a solder joint with higher contact resistance, which could develop a hotspot at first and an open electric connection afterwards. Figure 9 shows the IR thermographic image of a module with such an open cell string caused by a corroded solder joint.
Delamination of a polyamide backsheet at the top edge of a PV module can be seen in Figure 8 (left). The corrosion of a solder joint between a cell connector and a cross connector at the lower module edge has already led to visible formation of green copper acetate (Figure 8, right) which results from a chemical reaction of copper from the connector and acetic acid from the EVA. Possible outcome of this corrosion is a solder joint with higher contact resistance, which could develop a hotspot at first and an open electric connection afterwards. Figure 9 shows the IR thermographic image of a module with such an open cell string caused by a corroded solder joint.
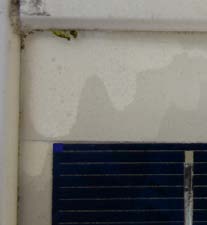
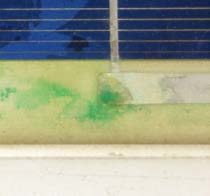
Figure 8: Delamination of the polyamide backsheet at the
upper edge of a module (left);
corrosion of a cross connection at the lower edge of a module with formation of copper acetate (right).
corrosion of a cross connection at the lower edge of a module with formation of copper acetate (right).
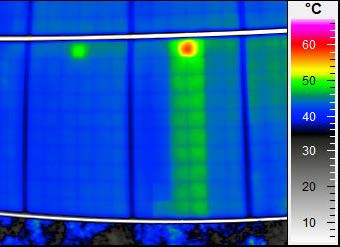
Figure 9: IR thermographic image of a PV module with
an unconnected cell string due to a corroded solder joint.
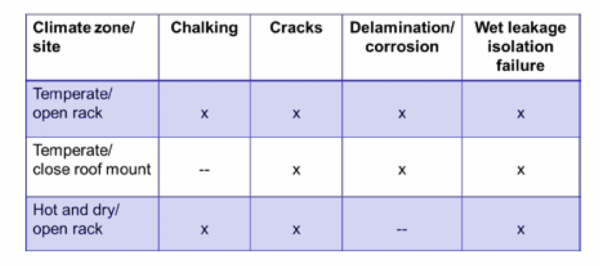
A correlation of the observed abnormal features of
polyamide backsheets with the site and the conditions of
field exposure can give some insight (Table 1). In the case
of a rooftop installation, where the module back surface is
apparently well protected from UV radiation, no chalking of the polyamide foil occurred. However, these modules
exhibited severe signs of degradation such as cracks in the BS, corrosion and hot-spots. This states, that chalking is not a prerequisite for the mechanical degradation of the BS.Delamination and corrosion only occurred on modules, which had been exposed in temperate climate but not in the hot-dry climatic region.Isolation faults, which have been observed at all installation sites, were caused either by cracks in the BS or by delamination at the module edge.
Table 1: Correlation of abnormal features and damages ofpolyamide backsheets with the installation sites
2.2 Identification of the backsheet material by FTIR spectroscopy
The surface of the BS of all tested modules has been investigated applying ATR-FTIR (Attenuated Total Reflection Fourier Transform Infrared) spectroscopy, which is a non-destructive, surface sensitive method of material analysis. Figure 10, Figure 11, and Figure 12 show examples of FTIR spectra of polyamide, PET und PVF (Tedlar). As has been stated above, the results on BS issues and damages presented here are only covering PV modules with AAA polyamide backsheet.
The surface of the BS of all tested modules has been investigated applying ATR-FTIR (Attenuated Total Reflection Fourier Transform Infrared) spectroscopy, which is a non-destructive, surface sensitive method of material analysis. Figure 10, Figure 11, and Figure 12 show examples of FTIR spectra of polyamide, PET und PVF (Tedlar). As has been stated above, the results on BS issues and damages presented here are only covering PV modules with AAA polyamide backsheet.
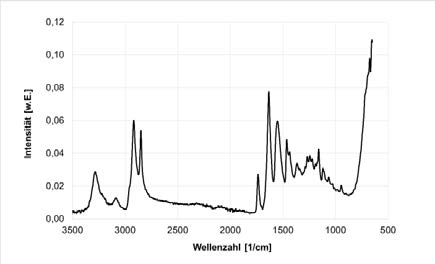
Figure 10: IFTIR spectrum of a polyamide back sheet
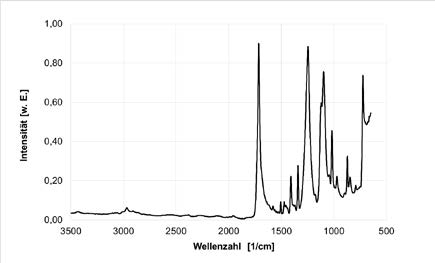
Figure 11: FTIR spectrum of a PET backsheet
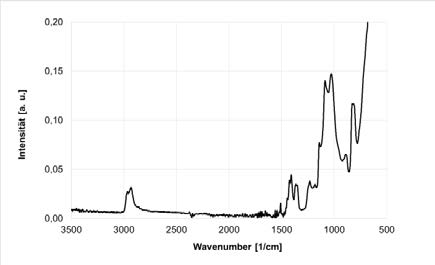
Figure 12: FTIR spectrum of a PVF (Tedlar) backsheet
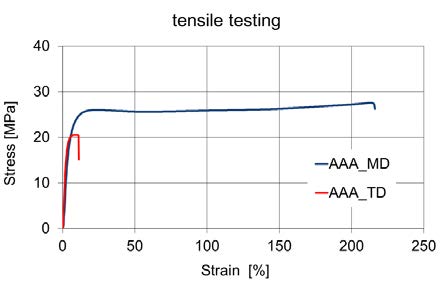
2.3 Elongation at break (EaB) and formation of cracks
The evaluation of the elongation at break of backsheets
from unexposed backup modules and from aged field
modules with a laboratory tension-testing machine gives
indications for the critical values below which cracks are
developing. Figure 13 shows examples of the strain-stress
characteristic of test stripes of AAA polyamide BS foils in
the machine direction of the polymer extruder (MD) and
in transversal direction (TD). The stripes, which have been
prepared according IEC 62788-2, are taken from the back
of a field-exposed module. The elongation at break in MD
is above 200 %, but is in TD below 20 %.
The evaluation of the EaB of about 100 test samples
prepared from unexposed modules and from field modules
both in MD and TD is given in Figure 14 and Figure 15,
respectively. It is especially noticeable, that the elongation
at break levels of the TD samples are considerable lower
than those of the MD samples. Concurrently, the outdoor
exposure of several years caused a significant reduction of
the elongation at break and hence a strong embrittlement
of the polyamide.
When correlating the formation of a BS crack in the
fielded sample modules with the respective elongation to
break measurement, the distribution presented in Figure 16
was achieved. For test samples with remaining EaB values
up to 10 %, a crack was observed in almost 60 % of the
cases. Modules, where the prepared BS stripes had EaB
values above 30 %, were free from visible cracking.
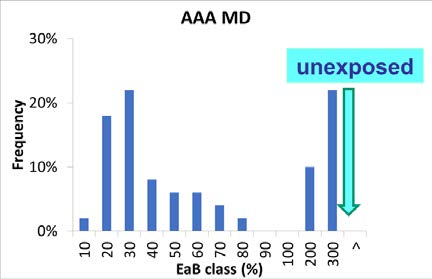
Figure 14: Frequency distribution of elongation at break
of polyamide BS samples in MD direction, from fielded
modules and from unexposed samples (pointer)
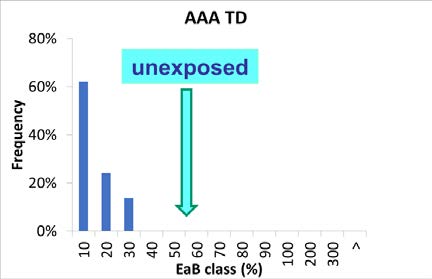
Figure 15: Frequency distribution of elongation at break
of polyamide BS samples in TD direction, from fielded
modules and from unexposed samples (pointer)
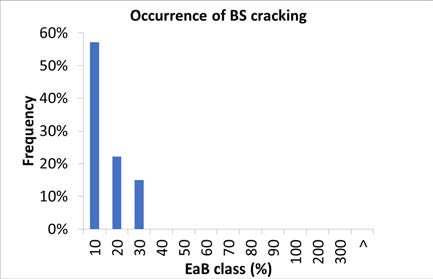
Figure 16: Frequency distribution of formation of cracks
in polyamide module BS in dependence of the measured
elongation at break level
2.4 Peel force and delamination
90°-peel-force measurements have been conducted on the test modules mostly in the upper and lower sections of the module but in some cases also at the module edge. For these tests, a stripe of 10 mm is cut into the backsidelaminate with a double scissor. The measurement of the peel-off force is executed over a path of 100 mm. In many cases, a loss of adhesion was observed at the interface of backsheet and EVA (Figure 17) with peel forces below 10 N/cm. It is remarkable, that a white surface was visible on the EVA after the peel-off of the BS which might be residua of Titanium dioxide stemming from the BS. In the cases where the peel forces are considerably higher with more than 20 N/cm (see blue curve in Figure 18), the fracture did not occur at theinterface of BS and EVA but at the interface of EVA and the rear side of the cell. For the assessment, the peel forces observed can be compared to the state of the art values for new modules. Data sheets of BS producers specify least adhesion forces for the interface of BS and EVA in the range of 40 N/cm to 60 N/cm [4]. Hence, the peeling forces that have been determined are far below the values stipulated by the producers. Low peel forces have been proven for all modules exhibiting delamination or corrosion (Figure 20). Almost 50 % of the modules with delamination showed peel forces below 5 N/cm. Modules which do not show a delamination failure show a somewhat higher peel force distribution shifted to a bit higher values (Figure 19). However, the correlation between occurrence of delamination and low peel force is rather weak.
90°-peel-force measurements have been conducted on the test modules mostly in the upper and lower sections of the module but in some cases also at the module edge. For these tests, a stripe of 10 mm is cut into the backsidelaminate with a double scissor. The measurement of the peel-off force is executed over a path of 100 mm. In many cases, a loss of adhesion was observed at the interface of backsheet and EVA (Figure 17) with peel forces below 10 N/cm. It is remarkable, that a white surface was visible on the EVA after the peel-off of the BS which might be residua of Titanium dioxide stemming from the BS. In the cases where the peel forces are considerably higher with more than 20 N/cm (see blue curve in Figure 18), the fracture did not occur at theinterface of BS and EVA but at the interface of EVA and the rear side of the cell. For the assessment, the peel forces observed can be compared to the state of the art values for new modules. Data sheets of BS producers specify least adhesion forces for the interface of BS and EVA in the range of 40 N/cm to 60 N/cm [4]. Hence, the peeling forces that have been determined are far below the values stipulated by the producers. Low peel forces have been proven for all modules exhibiting delamination or corrosion (Figure 20). Almost 50 % of the modules with delamination showed peel forces below 5 N/cm. Modules which do not show a delamination failure show a somewhat higher peel force distribution shifted to a bit higher values (Figure 19). However, the correlation between occurrence of delamination and low peel force is rather weak.
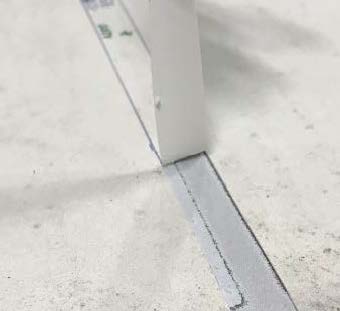
Figure 17: 90° peel testing; the polyamide BS detaches
from the EVA embedding material
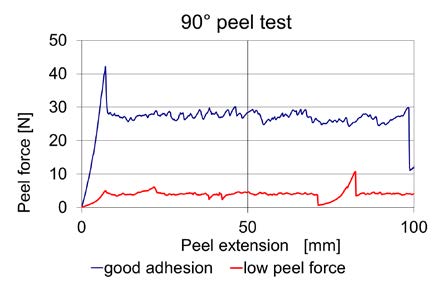
Figure 18: Force-path characteristic from 90° peel testing
of the BS from the substrate; sample with sufficient
adhesion (blue) and sample with low adhesion (red)
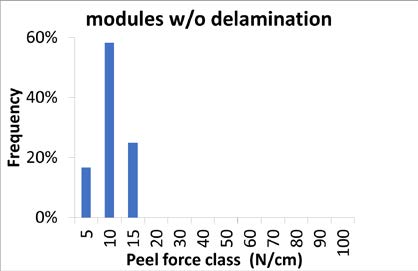
Figure 19: Frequency distribution of the peel force
(fracture at the EVA/AAA interface) for modules without
delamination.
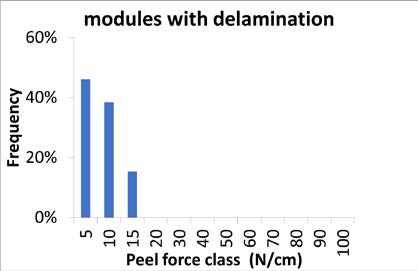
Figure 20: Frequency distribution of the peel force
(fracture at the EVA/AAA interface) for modules with
delamination.
3. SUMMARY
In the cases of backsheet issues (chalking, cracking,
delamination, corrosion) discussed here, the backsheet
material was AAA polyamide, which could be identified
applying ATR-FTIR spectroscopy.
Chalking is not a distinct feature to identify
mechanical degradation of the BS. There is virtually no
chalking if the AAA polyamide backside of the module is
protected from UV radiation, but modules showed
cracking of the BS.
The cracking of AAA backsheets observed in the field
could be correlated to low elongation to break values.
Cracks occur when the remaining elongation to break is
below 30 %.
Delamination and corrosion come along with low
peeling forces at the interface of BS and EVA. However,
the correlation between occurrence of delamination and
low peel force is rather weak.
4. ACKNOWLEDGEMENT
We would like to gratefully acknowledge the support
of Dr. Theresa Magorian-Friedlmeier for SEM analysis
and Dr. Wolfram Witte for Raman spectroscopy.
5. REFERENCES
[1] J. Althaus, PV Magazine Quality Roundtable 2018,Intersolar, München 2018
[2] P. Gebhardt, L. P. Bauermann, D. Phillip, 35th Europe Photovoltaic Solar Energy Conference and Exhibition
[3] N. Veronovski, Protection from the sun; European Coatings Journal, 03/2011
[4] Photon International; August 2013; „Tedlar´s backsheet comeback?“
[2] P. Gebhardt, L. P. Bauermann, D. Phillip, 35th Europe Photovoltaic Solar Energy Conference and Exhibition
[3] N. Veronovski, Protection from the sun; European Coatings Journal, 03/2011
[4] Photon International; August 2013; „Tedlar´s backsheet comeback?“